


Work
Resume
About Me
USER INTERVIEWS - HEURISTIC EVALUATIONS -DESIGN SOLUTIONS
Livewire
Conducted user interviews to improve the site's usability.
We found various issues ranging from minor to moderate and provided design solutions to improve the user experience.

Timeline
Aug 2024 - Dec 2024
Tools
Figma
Team
2 UX Designers
Overview
Livewire is a data platform that collects and provides urban science, transportation and mobility-related research and projects for researchers, academic institutes, and business partners. It is also available to the public to access, allowing people to view and upload data.
Because of this, there a lot of different sections on the site providing information and tools for searching, finding and downloading these projects. This in some cases led to confusion over how to reach and find specific items on the site.
I was brought on to organize and conduct a user research study to improve the site's overall usability, alongside supporting current user experience designers on the project. I was later brought back on to improve the user data uploading process.
Who Was I?
Acting as the User Research Lead, I created project timelines, led stakeholder meetings and user interviews, led heuristic evaluations and affinity diagramming sessions with my coworker, reached out to participants, and gave design suggestions to improve usability.
As a UX Designer, I supported other UX Designers during design ideations and designed accessible solutions for various parts of the site.
Overall Process
01
Context Gathering
02
User Interviews
03
Affinity Diagramming
04
Design Suggestions
Context Gathering
Onboarding
Being new to the project, I reached out to different parts of the team(UX, developers, and PMs) to learn more about the site and any current issues that we knew of.
What I learned was that there were two major areas that they wanted validation for:
Sort and Filter Options
Time Series Visualization
The current sort and filter options were lack luster for users who wanted more control over them.
As for the time series visualization, a major issue for the site was people downloading large files that took up a bandwidth and cost the stakeholder money each time a file was downloaded. Due to the large size of the files, this could add up for the company in terms as well as for the user in terms of space.
These were areas that had issues with in the past and learning more about would improve the user experience of the site.
From here, I created a couple of research goals to design the study around:
Research Goals
Find out how users typically search and navigate Livewire to learn about how their day to day processes in order to improve site navigation and search
Discover how users interact with the sort and filter tabs in order to prioritize frequently used sort and filters
Learn more about users' preferences for previewing dataset information to decrease unnecessary downloads and frustration
Alongside the above, I also identified user groups that we would want to target in the interviews. The site would be primarily by people interested in urban science, which targeted researchers, industry partners, and academic use but was also open to the general public.
User Groups

Data Users
Wants to use datasets for learning or research use
Consists of researchers, grant writers, and the general public

Data Uploaders
Want to upload and share their data with other people
Consists of researchers, industry, and academic partners
Road Block
At this point, I had created a research plan with questions for participants and was ready to get going. However, the timeline ended up being pushed back a month due to scheduling issues with feedback givers. In order to take advantage of the extra time, I reached out for more feedback from UX professionals via pilot interviews:
Pilot Interviews
Before meeting with users, I set up pilot interviews with a fellow UX Designer as well as a developer working on the site. These each granted a lot of feedback and allowed me to make changes to the structure of the interview, such as changing one of the sections to involve usability testing rather than contextual inquiry. It also
Interviewing
User Interviews
We chose to do virtual user interviews due to the time and budget constraints, alongside being able to record the respondent’s screens for notetaking and review.
I was directed to 5 people who were available for interviews. They tended to work in and around the filed of urban science and contained users who had used the site before and those who were entirely knew.
The interviews took place over two weeks, with a day in between to look back over notes and begin diagramming findings. All interviews were conducted virtually using Microsoft Teams.
During the session, each person was first asked questions about what their general background(job,field, etc.) and what their daily workday would involve. This led into the next section where I asked them to show their general process of using Livewire via screen sharing.
Afterwards, I asked them to complete more specific tasks to figure out if certain features were able to be found.
After the last task was completed, the user was asked to rank their overall experience using a Likert scale and asked about what went into their rating.
Findings
Affinity Diagramming
We grouped the major ideas that the participants talked about during the interviews into 5 major themes with subcategories for each:
- Data Specifics
- Data Upload/Download
- Usability Heuristics
- Search/Sort/Filters
- Miscellaneous
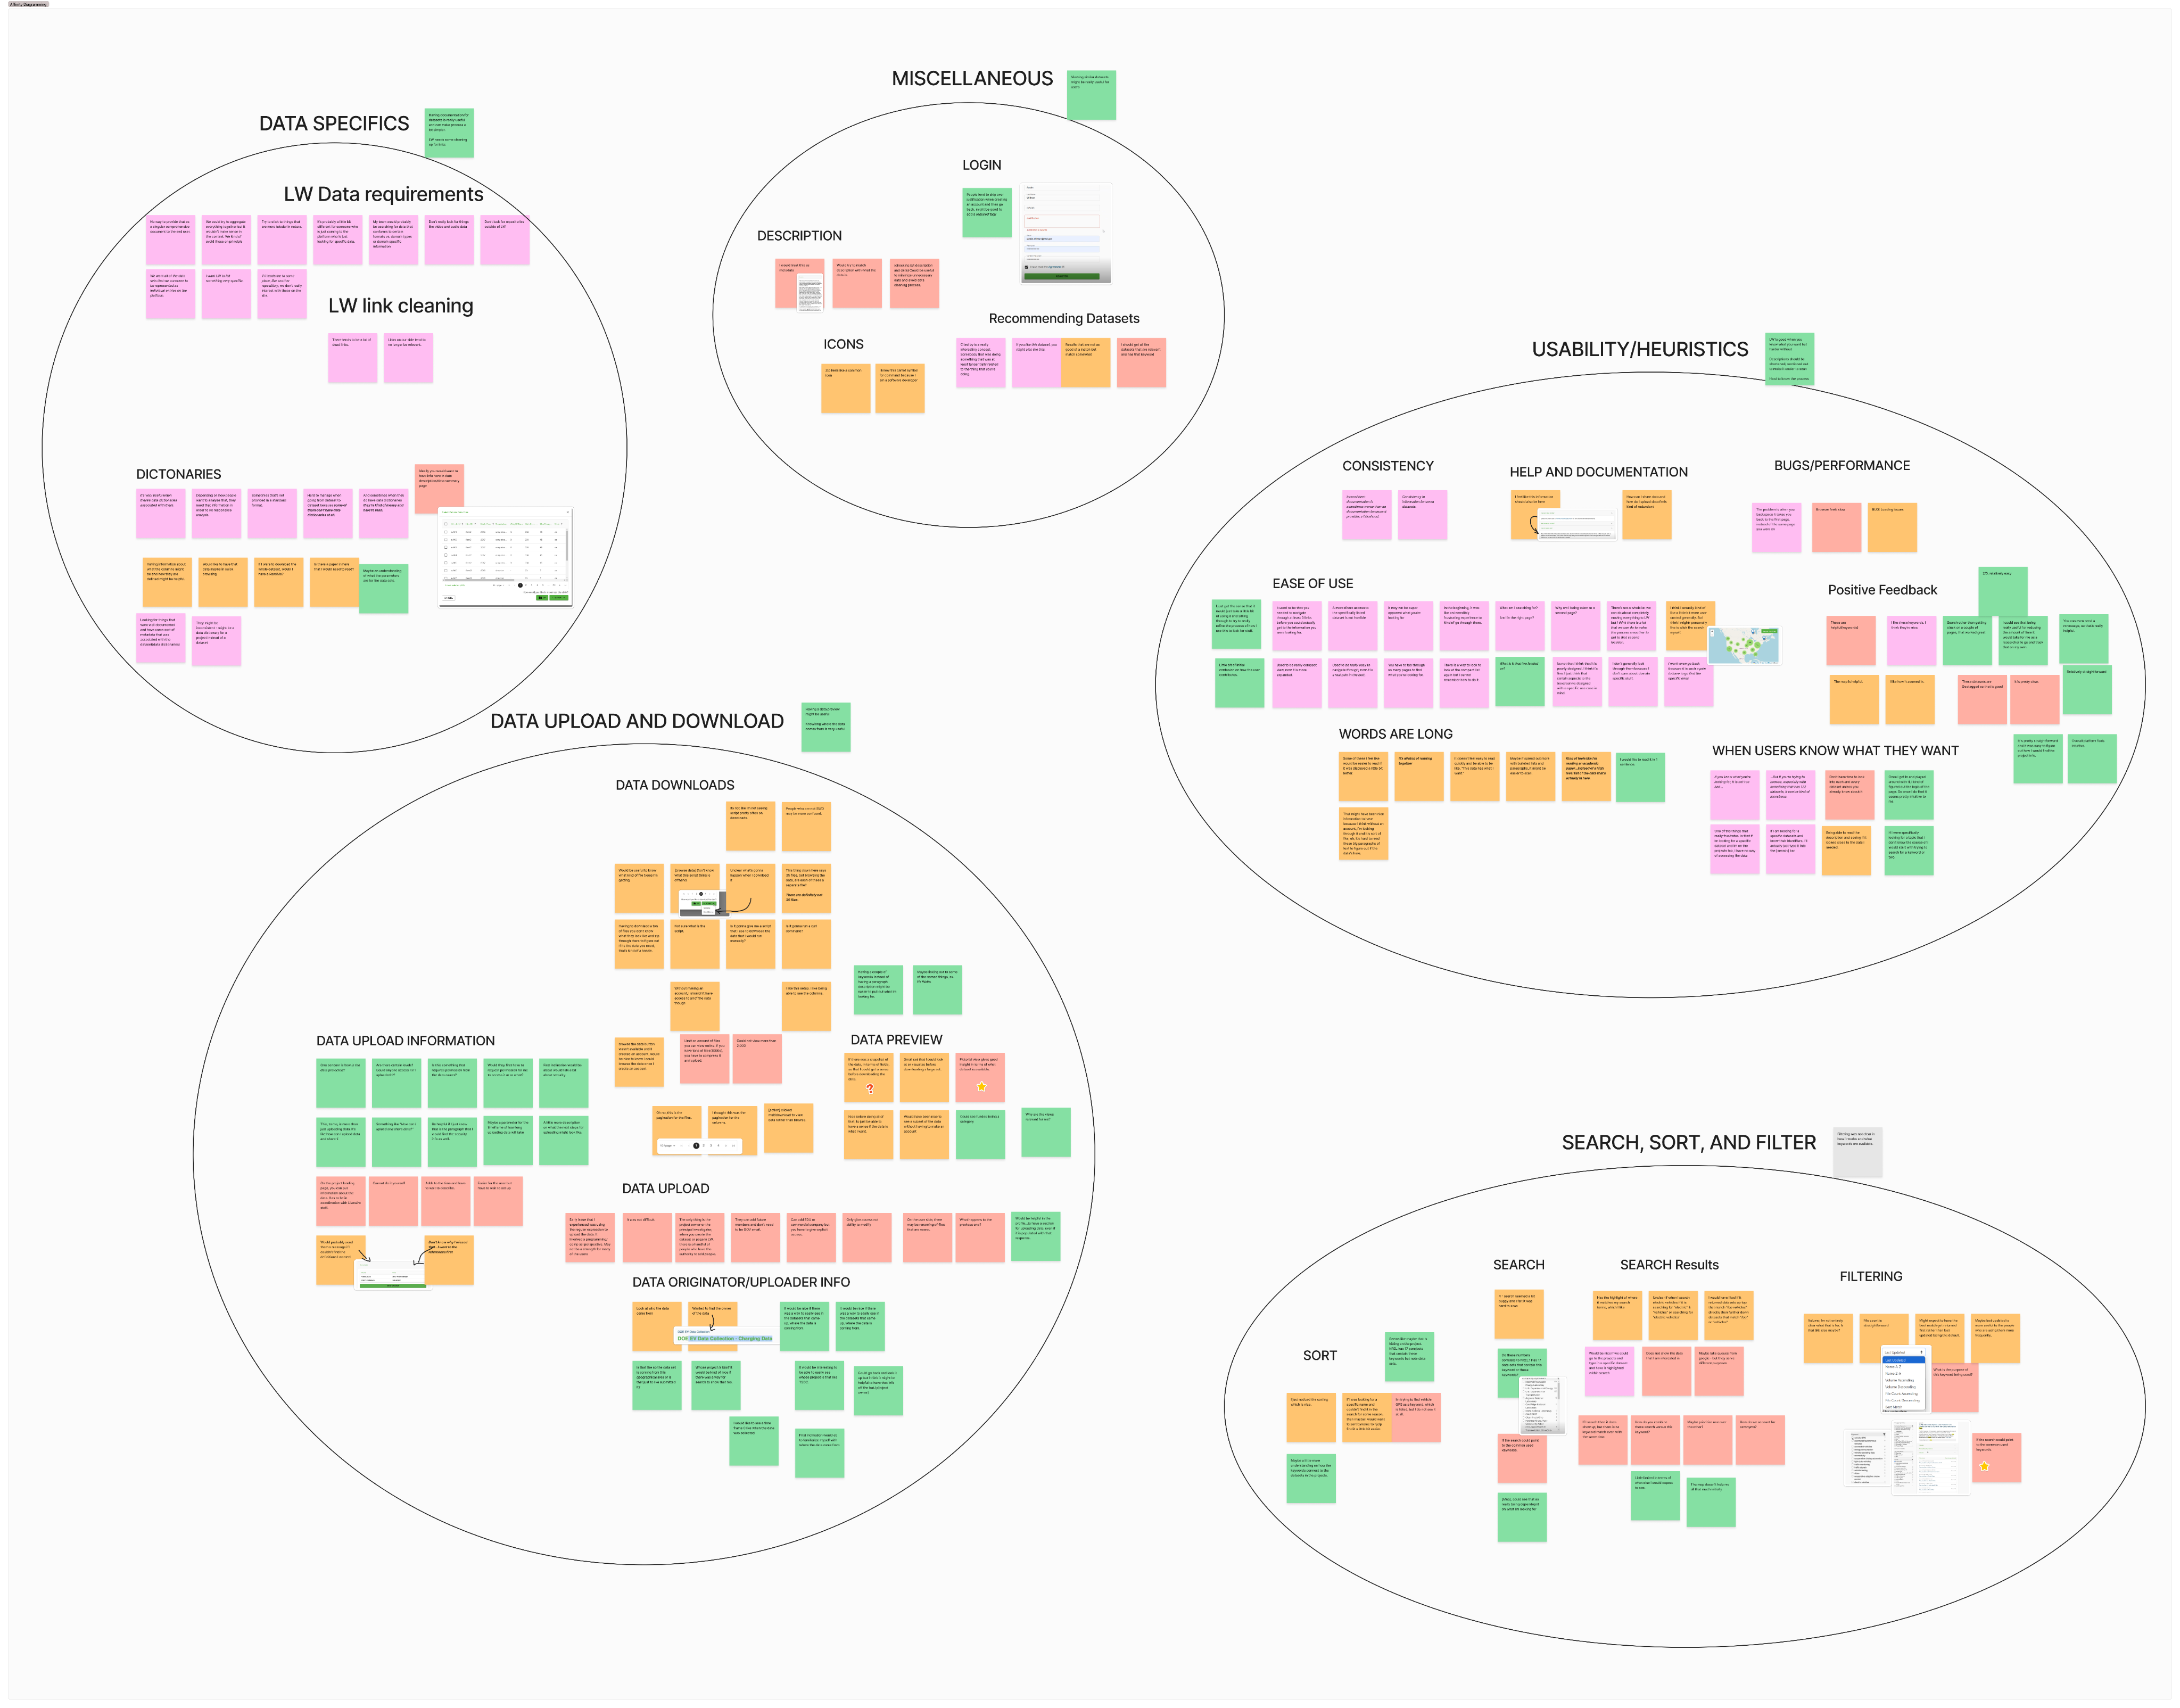
Affinity Diagram Picture
We then used these categories to come up with and organize recommendations for the development team.
Insights
Our research found that users viewed the site over all as very usable. However, as suspected, there were a few major issues that the users had:
- Users wanted more methods of visualizing datasets and information related to it
- 15 usability issues split between major and minor
- The ability to upload data to the site was not always clear to users
What to Do Next?
Creating Recommendations
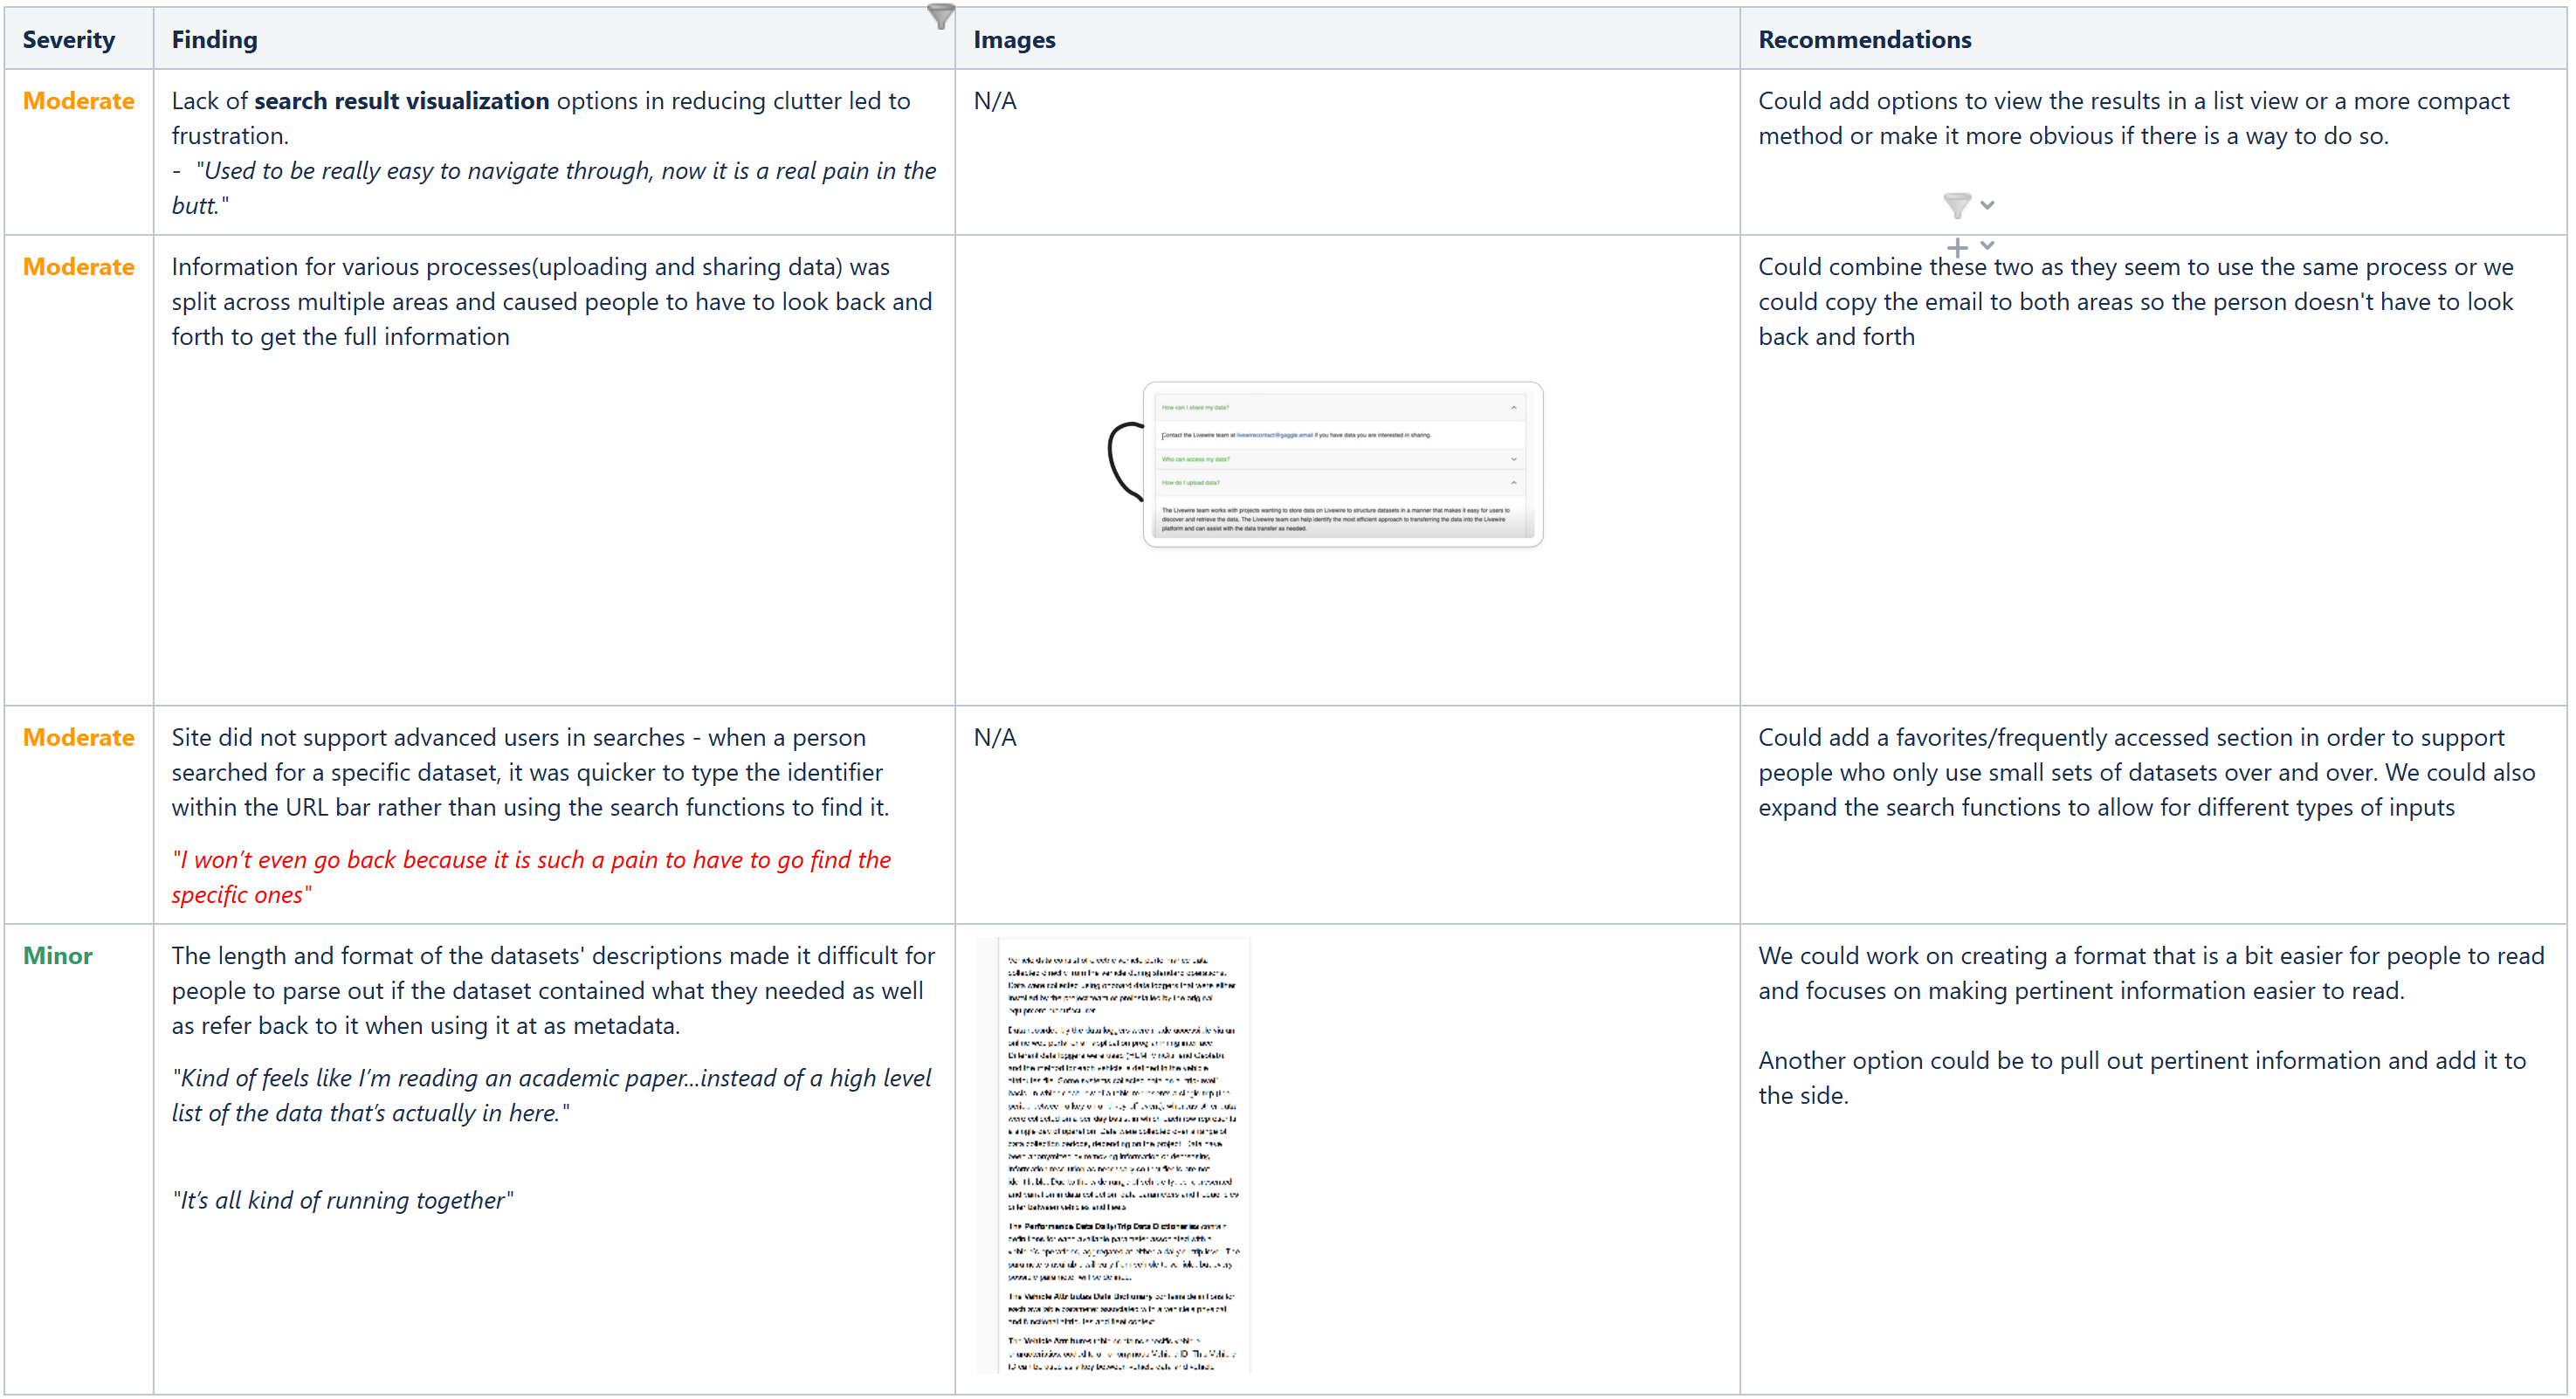
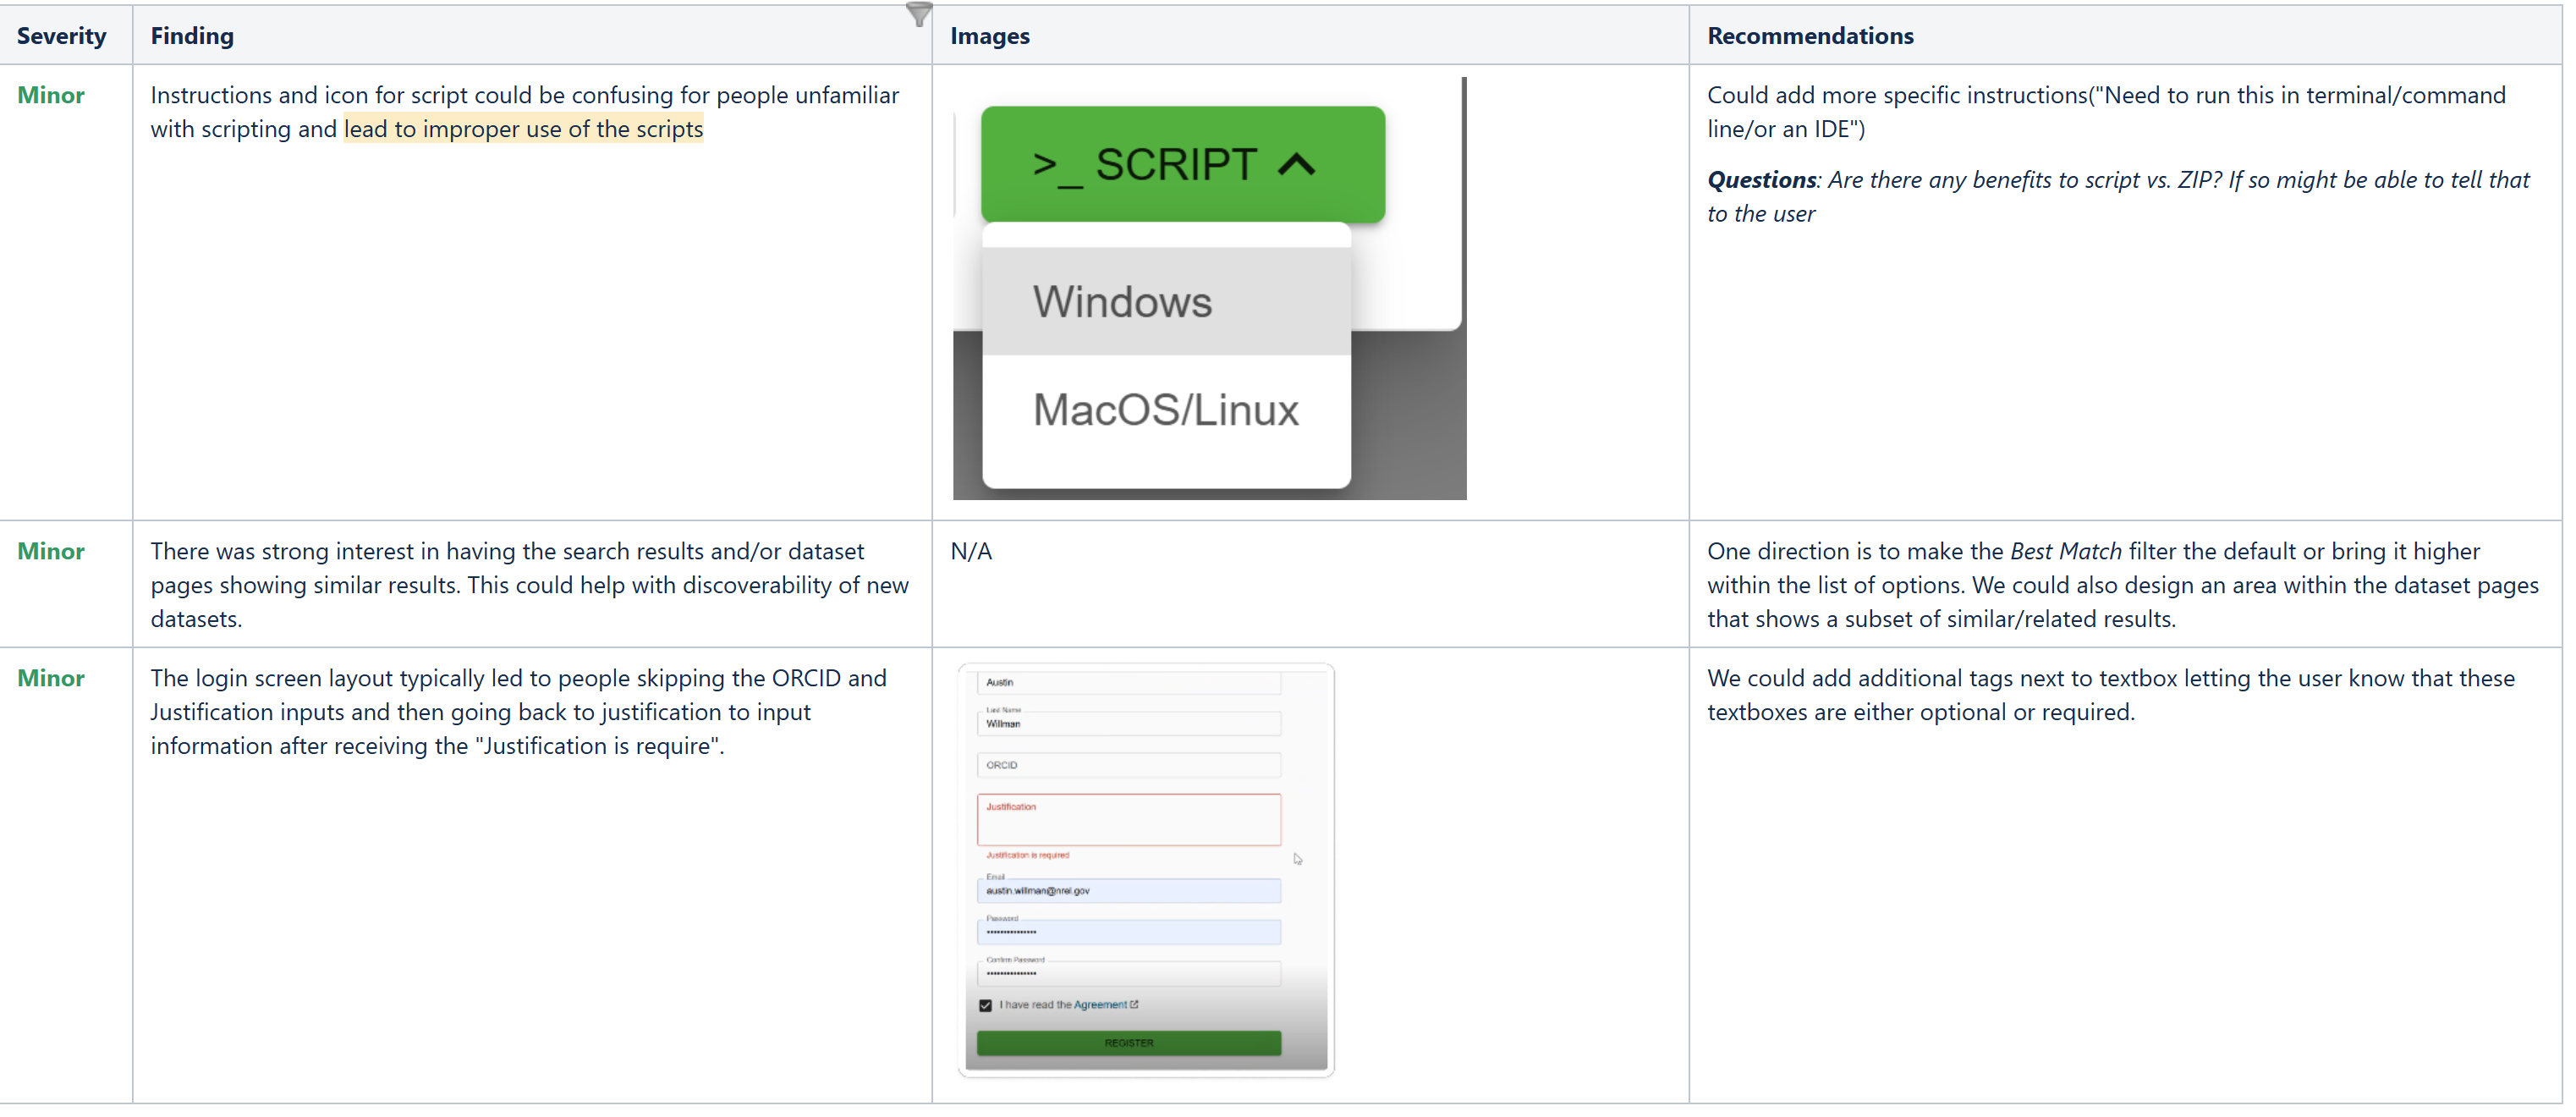
Based on the issues we found, we began working on a list of recommendations and designs that could be implemented to improve the user experience.
Results
Our research and suggestions allowed users to better be able to find the information they needed. The greatest improvements made were the information placement and the sort and filters. We were able to combine information for FAQs to make understanding the uploading process and getting in contact with the support team easier.
Alongside this, the goal of decreasing unneeded downloads was met! Visualizations about various datasets are available to be used in order to allow users to make better decisions as to whether they should download a dataset or not.
Lessons Learned
Be Prepared For Time Challenges
One of the things I learned from this project was to set up buffers for how long a project might take. I initially planned for the project to take around 2 months, with a smaller budget. Whilst we did generally stick to the budget, the time ended up taking closer to 3.5 months due to schedule conflicts and the feedback process taking a bit longer than I knew at the time.
Nowadays, I try to get in contact with people to find out information about what various parts of the research process might take depending on what's needed. I also make sure to place in a buffer as even if everything is going to plan, sometimes life just gets in the way, for either the researchers, participants, mentors, etc., that can cause the project to come to a halt for a bit.
Advocate for More Specific Users
The users I got were lovely to work with and interview. However, I do wish I pushed back a bit more and was able to get users who were directly related to the project. Whilst I got a lot of good feedback, it did sometimes feel disconnected from the website.
Future Improvements
Improve the uploading process
This study focused mostly on the data user side of things vs. the data uploader. This is in part due to most of the interviewees being data users and not having much, if any, experience with data uploading. In the future, I want to improve this feature via providing better documentation and making the process more streamlined.
For now, I have suggested and had features added that improved the ability for people to contact the support team, alongside making the feature more prominent for newer users.


Work
Resume
About Me
USER INTERVIEWS - HEURISTIC EVALUATIONS -DESIGN SOLUTIONS
Livewire
Conducted user interviews to improve the site's usability. We found various issues ranging from minor to moderate and provided design solutions to improve the user experience.

Timeline
Aug 2024 - Dec 2024
Tools
Figma
Team
2 UX Designers
Overview
Livewire is a data platform that collects and provides urban science, transportation and mobility-related research and projects for researchers, academic institutes, and business partners. It is also available to the public to access, allowing people to view and upload data.
Because of this, there a lot of different sections on the site providing information and tools for searching, finding and downloading these projects. This in some cases led to confusion over how to reach and find specific items on the site.
I was brought on to organize and conduct a user research study to improve the site's overall usability, alongside supporting current user experience designers on the project. I was later brought back on to improve the user data uploading process.
Who Was I?
Acting as the User Research Lead, I created project timelines, led stakeholder meetings and user interviews, led heuristic evaluations and affinity diagramming sessions with my coworker, reached out to participants, and gave design suggestions to improve usability.
As a UX Designer, I supported other UX Designers during design ideations and designed accessible solutions for various parts of the site.
Overall Process
01
Context Gathering
02
User Interviews
03
Affinity Diagramming
04
Design Suggestions
Context Gathering
Onboarding
Being new to the project, I reached out to different parts of the team(UX, developers, and PMs) to learn more about the site and any current issues that we knew of.
What I learned was that there were two major areas that they wanted validation for:
Sort and Filter Options
Time Series Visualization
The current sort and filter options were lack luster for users who wanted more control over them.
As for the time series visualization, a major issue for the site was people downloading large files that took up a bandwidth and cost the stakeholder money each time a file was downloaded. Due to the large size of the files, this could add up for the company in terms as well as for the user in terms of space.
These were areas that had issues with in the past and learning more about would improve the user experience of the site.
From here, I created a couple of research goals to design the study around:
Research Goals
Find out how users typically search and navigate Livewire to learn about how their day to day processes in order to improve site navigation and search
Discover how users interact with the sort and filter tabs in order to prioritize frequently used sort and filters
Learn more about users' preferences for previewing dataset information to decrease unnecessary downloads and frustration
Alongside the above, I also identified user groups that we would want to target in the interviews. The site would be primarily by people interested in urban science, which targeted researchers, industry partners, and academic use but was also open to the general public.
User Groups
Data Users
Wants to use datasets for learning or research use
Consists of researchers, grant writers, and the general public

Data Uploaders
Want to upload and share their data with other people
Consists of researchers, industry, and academic partners
Road Block
At this point, I had created a research plan with questions for participants and was ready to get going. However, the timeline ended up being pushed back a month due to scheduling issues with feedback givers. In order to take advantage of the extra time, I reached out for more feedback from UX professionals via pilot interviews:
Pilot Interviews
Before meeting with users, I set up pilot interviews with a fellow UX Designer as well as a developer working on the site. These each granted a lot of feedback and allowed me to make changes to the structure of the interview, such as changing one of the sections to involve usability testing rather than contextual inquiry. It also
Interviewing
User Interviews
We chose to do virtual user interviews due to the time and budget constraints, alongside being able to record the respondent’s screens for notetaking and review.
I was directed to 5 people who were available for interviews. They tended to work in and around the filed of urban science and contained users who had used the site before and those who were entirely knew.
The interviews took place over two weeks, with a day in between to look back over notes and begin diagramming findings. All interviews were conducted virtually using Microsoft Teams.
During the session, each person was first asked questions about what their general background(job,field, etc.) and what their daily workday would involve. This led into the next section where I asked them to show their general process of using Livewire via screen sharing.
Afterwards, I asked them to complete more specific tasks to figure out if certain features were able to be found.
After the last task was completed, the user was asked to rank their overall experience using a Likert scale and asked about what went into their rating.
Findings
Affinity Diagramming
We grouped the major ideas that the participants talked about during the interviews into 5 major themes with subcategories for each:
- Data Specifics
- Data Upload/Download
- Usability Heuristics
- Search/Sort/Filters
- Miscellaneous
Affinity Diagram Picture
We then used these categories to come up with and organize recommendations for the development team.
Insights
Our research found that users viewed the site over all as very usable. However, as suspected, there were a few major issues that the users had:
Users wanted more methods of visualizing datasets and information related to it
15 usability issues split between major and minor
The ability to upload data to the site was not always clear to users
What to Do Next?
Creating Recommendations
Based on the issues we found, we began working on a list of recommendations and designs that could be implemented to improve the user experience.
Results
Our research and suggestions allowed users to better be able to find the information they needed. The greatest improvements made were the information placement and the sort and filters. We were able to combine information for FAQs to make understanding the uploading process and getting in contact with the support team easier.
Alongside this, the goal of decreasing unneeded downloads was met! Visualizations about various datasets are available to be used in order to allow users to make better decisions as to whether they should download a dataset or not.
Lessons Learned
Be Prepared For Time Challenges
One of the things I learned from this project was to set up buffers for how long a project might take. I initially planned for the project to take around 2 months, with a smaller budget. Whilst we did generally stick to the budget, the time ended up taking closer to 3.5 months due to schedule conflicts and the feedback process taking a bit longer than I knew at the time.
Nowadays, I try to get in contact with people to find out information about what various parts of the research process might take depending on what's needed. I also make sure to place in a buffer as even if everything is going to plan, sometimes life just gets in the way, for either the researchers, participants, mentors, etc., that can cause the project to come to a halt for a bit.
Advocate for More Specific Users
The users I got were lovely to work with and interview. However, I do wish I pushed back a bit more and was able to get users who were directly related to the project. Whilst I got a lot of good feedback, it did sometimes feel disconnected from the website.
Future Improvements
Improve the uploading process
This study focused mostly on the data user side of things vs. the data uploader. This is in part due to most of the interviewees being data users and not having much, if any, experience with data uploading. In the future, I want to improve this feature via providing better documentation and making the process more streamlined.
For now, I have suggested and had features added that improved the ability for people to contact the support team, alongside making the feature more prominent for newer users.
Work
Resume
About Me
USER INTERVIEWS - HEURISTIC EVALUATIONS -DESIGN SOLUTIONS
Livewire
Conducted user interviews to improve the site's usability. We found various issues ranging from minor to moderate and provided design solutions to improve the user experience.

Timeline
Aug 2024 - Dec 2024
Tools
Figma
Team
2 UX Designers
Overview
Livewire is a data platform that collects and provides urban science, transportation and mobility-related research and projects for researchers, academic institutes, and business partners. It is also available to the public to access, allowing people to view and upload data.
Because of this, there a lot of different sections on the site providing information and tools for searching, finding and downloading these projects. This in some cases led to confusion over how to reach and find specific items on the site.
I was brought on to organize and conduct a user research study to improve the site's overall usability, alongside supporting current user experience designers on the project. I was later brought back on to improve the user data uploading process.
Who Was I?
Acting as the User Research Lead, I created project timelines, led stakeholder meetings and user interviews, led heuristic evaluations and affinity diagramming sessions with my coworker, reached out to participants, and gave design suggestions to improve usability.
As a UX Designer, I supported other UX Designers during design ideations and designed accessible solutions for various parts of the site.
Overall Process
01
Context Gathering
02
User Interviews
03
Affinity Diagramming
04
Design Suggestions
Context Gathering
Onboarding
Being new to the project, I reached out to different parts of the team(UX, developers, and PMs) to learn more about the site and any current issues that we knew of.
What I learned was that there were two major areas that they wanted validation for:
Sort and Filter Options
Time Series Visualization
The current sort and filter options were lack luster for users who wanted more control over them.
As for the time series visualization, a major issue for the site was people downloading large files that took up a bandwidth and cost the stakeholder money each time a file was downloaded. Due to the large size of the files, this could add up for the company in terms as well as for the user in terms of space.
These were areas that had issues with in the past and learning more about would improve the user experience of the site.
From here, I created a couple of research goals to design the study around:
Research Goals
Find out how users typically search and navigate Livewire to learn about how their day to day processes in order to improve site navigation and search
Discover how users interact with the sort and filter tabs in order to prioritize frequently used sort and filters
Learn more about users' preferences for previewing dataset information to decrease unnecessary downloads and frustration
Alongside the above, I also identified user groups that we would want to target in the interviews. The site would be primarily by people interested in urban science, which targeted researchers, industry partners, and academic use but was also open to the general public.
User Groups

Data Users
Wants to use datasets for learning or research use
Consists of researchers, grant writers, and the general public

Data Uploaders
Want to upload and share their data with other people
Consists of researchers, industry, and academic partners
Road Block
At this point, I had created a research plan with questions for participants and was ready to get going. However, the timeline ended up being pushed back a month due to scheduling issues with feedback givers. In order to take advantage of the extra time, I reached out for more feedback from UX professionals via pilot interviews:
Pilot Interviews
Before meeting with users, I set up pilot interviews with a fellow UX Designer as well as a developer working on the site. These each granted a lot of feedback and allowed me to make changes to the structure of the interview, such as changing one of the sections to involve usability testing rather than contextual inquiry. It also
Interviewing
User Interviews
We chose to do virtual user interviews due to the time and budget constraints, alongside being able to record the respondent’s screens for notetaking and review.
I was directed to 5 people who were available for interviews. They tended to work in and around the filed of urban science and contained users who had used the site before and those who were entirely knew.
The interviews took place over two weeks, with a day in between to look back over notes and begin diagramming findings. All interviews were conducted virtually using Microsoft Teams.
During the session, each person was first asked questions about what their general background(job,field, etc.) and what their daily workday would involve. This led into the next section where I asked them to show their general process of using Livewire via screen sharing.
Afterwards, I asked them to complete more specific tasks to figure out if certain features were able to be found.
After the last task was completed, the user was asked to rank their overall experience using a Likert scale and asked about what went into their rating.
Findings
Affinity Diagramming
We grouped the major ideas that the participants talked about during the interviews into 5 major themes with subcategories for each:
- Data Specifics
- Data Upload/Download
- Usability Heuristics
- Search/Sort/Filters
- Miscellaneous
Affinity Diagram Picture
We then used these categories to come up with and organize recommendations for the development team.
Insights
Our research found that users viewed the site over all as very usable. However, as suspected, there were a few major issues that the users had:
Users wanted more methods of visualizing datasets and information related to it
15 usability issues split between major and minor
The ability to upload data to the site was not always clear to users
What to Do Next?
Creating Recommendations
Based on the issues we found, we began working on a list of recommendations and designs that could be implemented to improve the user experience.
Results
Our research and suggestions allowed users to better be able to find the information they needed. The greatest improvements made were the information placement and the sort and filters. We were able to combine information for FAQs to make understanding the uploading process and getting in contact with the support team easier.
Alongside this, the goal of decreasing unneeded downloads was met! Visualizations about various datasets are available to be used in order to allow users to make better decisions as to whether they should download a dataset or not.
Lessons Learned
Be Prepared For Time Challenges
One of the things I learned from this project was to set up buffers for how long a project might take. I initially planned for the project to take around 2 months, with a smaller budget. Whilst we did generally stick to the budget, the time ended up taking closer to 3.5 months due to schedule conflicts and the feedback process taking a bit longer than I knew at the time.
Nowadays, I try to get in contact with people to find out information about what various parts of the research process might take depending on what's needed. I also make sure to place in a buffer as even if everything is going to plan, sometimes life just gets in the way, for either the researchers, participants, mentors, etc., that can cause the project to come to a halt for a bit.
Advocate for More Specific Users
The users I got were lovely to work with and interview. However, I do wish I pushed back a bit more and was able to get users who were directly related to the project. Whilst I got a lot of good feedback, it did sometimes feel disconnected from the website.
Future Improvements
Improve the uploading process
This study focused mostly on the data user side of things vs. the data uploader. This is in part due to most of the interviewees being data users and not having much, if any, experience with data uploading. In the future, I want to improve this feature via providing better documentation and making the process more streamlined.
For now, I have suggested and had features added that improved the ability for people to contact the support team, alongside making the feature more prominent for newer users.